Market Report · September 2026 Edition
The Charleston Tri-County market: paced, not stalled
Median prices have held steady through 2026 while homes take longer to sell than they did two years ago. That combination rewards preparation on the seller side and patience on the buyer side, and it changes how pricing, marketing, and negotiation should be run.
This report summarizes public market data for the Charleston region as of mid-2026, reads what the numbers mean for the four counties Denise serves, and closes with the advice she gives clients in this market. It is an educational summary, not an appraisal, and your address deserves a personalized review.
$449,990
regional median sale price, mid-2026
up about 2.3% in the first half of 2026
57
median days on market, July 2026
metro-wide, per FRED / Realtor.com
46
days for the fastest-selling range
$500,001-$750,000, past 12 months
$200K-$1.5M+
Denise's typical client range
from first homes to waterfront estates
The Numbers · Sourced Public Data
What the data says
The Charleston region's median sale price landed near $444,600 for the full year 2025, up about 2.4% from the year before. Through the first half of 2026 the regional median has held around $440,000 to $450,000, with reports showing roughly 2.3% to 2.7% year-over-year growth depending on the measure. In plain terms: prices are steady, not collapsing and not spiking.
Time on market tells the sharper story. Metro-wide median days on market reached about 57 days by July 2026, per FRED and Realtor.com data, up noticeably from about 40 to 50 days in 2025. But the fastest-selling price band, $500,001 to $750,000, has been turning in about 46 days over the past twelve months, which shows how much the market splits by price point and neighborhood.
The takeaway is not that the market is weak. It is that the market now separates the prepared from the hopeful faster than it used to. Homes priced from evidence with real marketing still move. Homes priced from hope sit, and age like produce.
County by County · Four Different Markets
The Tri-County is not one market
Berkeley County
The growth engine: Cane Bay, Nexton, and Carnes Crossroads keep Berkeley among the most active new-construction counties in the state, drawing families, relocations, and first-time buyers.
Dorchester County
Summerville and its corridor blend established neighborhoods with new construction, served by Dorchester School District Two, and a commute that trades distance for house.
Charleston County
The peninsula, Mount Pleasant, and the islands carry the metro's highest prices and strongest demand. Inventory is tighter and the market moves faster per listing.
Orangeburg County
A different price point entirely, with new construction near or below $250,000 and a location at I-26 and I-95 that keeps both Charleston and Columbia in reach.
What It Means · Four Readerships
Advice for this market
For sellers
The market has shifted from a sprint to a paced market. Days on market are up from two years ago, which means pricing from evidence and preparation matter more, not less. The homes selling quickly are the ones priced, positioned, and marketed deliberately.
Read the guide →For buyers
More inventory means more negotiating room, especially on terms, closing dates, and repairs. But the fastest-selling price range still turns in about six weeks, so a strong offer still wins. Pre-approval is the foundation.
Read the guide →For new construction
Builders are using incentives, rate buydowns, and closing cost credits to keep sales moving. Those incentives are real and worth comparing, but the total cost of the home, including lot premiums and upgrades, is the number that matters.
Read the guide →For affordability
Orangeburg County new construction frequently lists below $250,000, with recent examples near $200,000 to $245,000. For buyers priced out of Charleston-area communities, that is a genuine alternative worth a drive.
Read the guide →Sources & Method
Figures summarized from public sources including the Federal Reserve Economic Data series for the Charleston-North Charleston metro, Realtor.com market data, Charleston Trident Association of REALTORS® reports, and regional 2025-2026 market reviews published by the Post and Courier, Stacker, and Charleston area market analyses. Median figures vary by source and geography; this report is an educational summary, not an appraisal or a guarantee. Ask Denise for a personalized review of your home or target neighborhood.
The House View
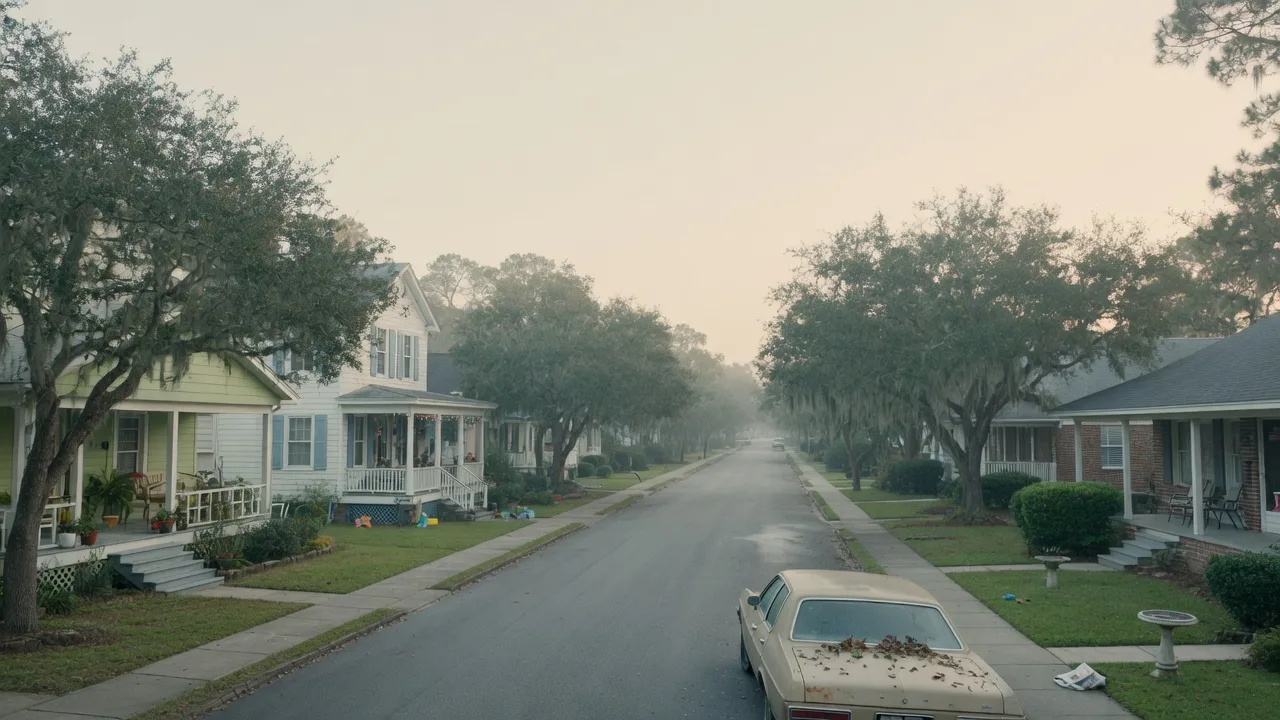
The numbers move by street, not by headline
A regional median hides your neighborhood. Cane Bay, a Dowtown single house, an Orangeburg new build, and a Summerville ranch are four different markets wearing one headline. The useful question is never "how is the market?" It is "what has happened on your street in the last 90 days?"
That is the analysis Denise runs for every client: closed sales, active competition, days on market, and condition, for your address, in your market, today.
Get your address's readPersonalize It · Free & No Obligation
Your street, your numbers
The report above is the regional picture. The free Home Value & Equity Review is your street's picture, built from your neighborhood's recent sales, current competition, and your home's condition.
Request a Free Market Review
Share the address and what you want to know: value, equity, pricing strategy, or what the market says about your next move.
Thank you.
Your request is in. Call (843) 814-5454 if you need an answer faster.